A Textual analysis of interview transcripts
While this study has primarily focused on a qualitative assessment of the interview transcripts gathered, additional insights into participant responses can be gained with a supplementary quantitative textual analysis. Quantitative approaches to textual analysis, sometimes referred to as natural language processing, follow a process of tokenising the text by splitting it into smaller meaningful units (Silge and Robinson, 2017). Often the token unit is a single word, but can also consist of multiple words (n-grams), sentences, or paragraphs. Tokenising text allows the corpus of text under analysis to be presented as a document feature matrix, with one row per observation (in this instance, participant interview) and a column per feature (token) containing the frequency count for each particular feature contained within that observation. This process of presenting textual data as numerical allows the data to then be counted, aggregated, summarised, and further processed with quantitative techniques. The following analyses were conducted using R (R Core Team, 2020) in Rstudio (ver. 1.4.1717).
A.1 Interview transcript similarity using cosine similarity scores
Qualitative data collection often ceases at the point where the researcher(s) conducting the study considers a point of data saturation to have been reached, described as the point at which new data no longer reveals new meaningful features (Aldiabat and Le Navenec, 2018). This is a subjective decision made using the researchers own experience of the data gathered and the similarity amongst responses received. In this study in particular, as the interviews were to be processed into a single model drawn from multiple participant experiences, it was also important to determine if responses given drastically differed from each other in a manner that indicated incompatibility.
It is possible to objectively measure the similarity between texts by comparing the occurrence and frequency counts of tokens between two texts. As these have been tokenised, comparing two texts becomes a comparison between two vectors of numbers and quantitative measures can be applied to determine similarity. A standard method of comparing the similarity of text is cosine similarity, or the cosine of the angle between two vectors (Singhal, 2001). When applied to text analysis, the cosine is of the angle between the vectors of token frequencies provided by the two documents being compared and is calculated with:
\[ similarity =\cos (\theta)=\frac{\mathbf{A} \cdot \mathbf{B}}{\|\mathbf{A}\|\|\mathbf{B}\|}=\frac{\sum_{i=1}^{n} A_{i} B_{i}}{\sqrt{\sum_{i=1}^{n} A_{i}^{2}} \sqrt{\sum_{i=1}^{n} B_{i}^{2}}} \]
where A and B are the two term frequency vectors of the documents being compared. Interpreting similarity as an angle in vector space with this method normalises the text regardless of length, as even if the documents differ drastically in size (and therefore may differ if plotted in Euclidean space despite their term similarity), the angle between their vectors remains the same.
Cosine similarity results in scores between 0 and 1 and can be read as a percentage, e.g. a cosine similarity score of 0.8 indicates the documents are 80% similar. Cosine similarity scores between all participant responses recorded in the interview transcripts are reported in Figure A.1.
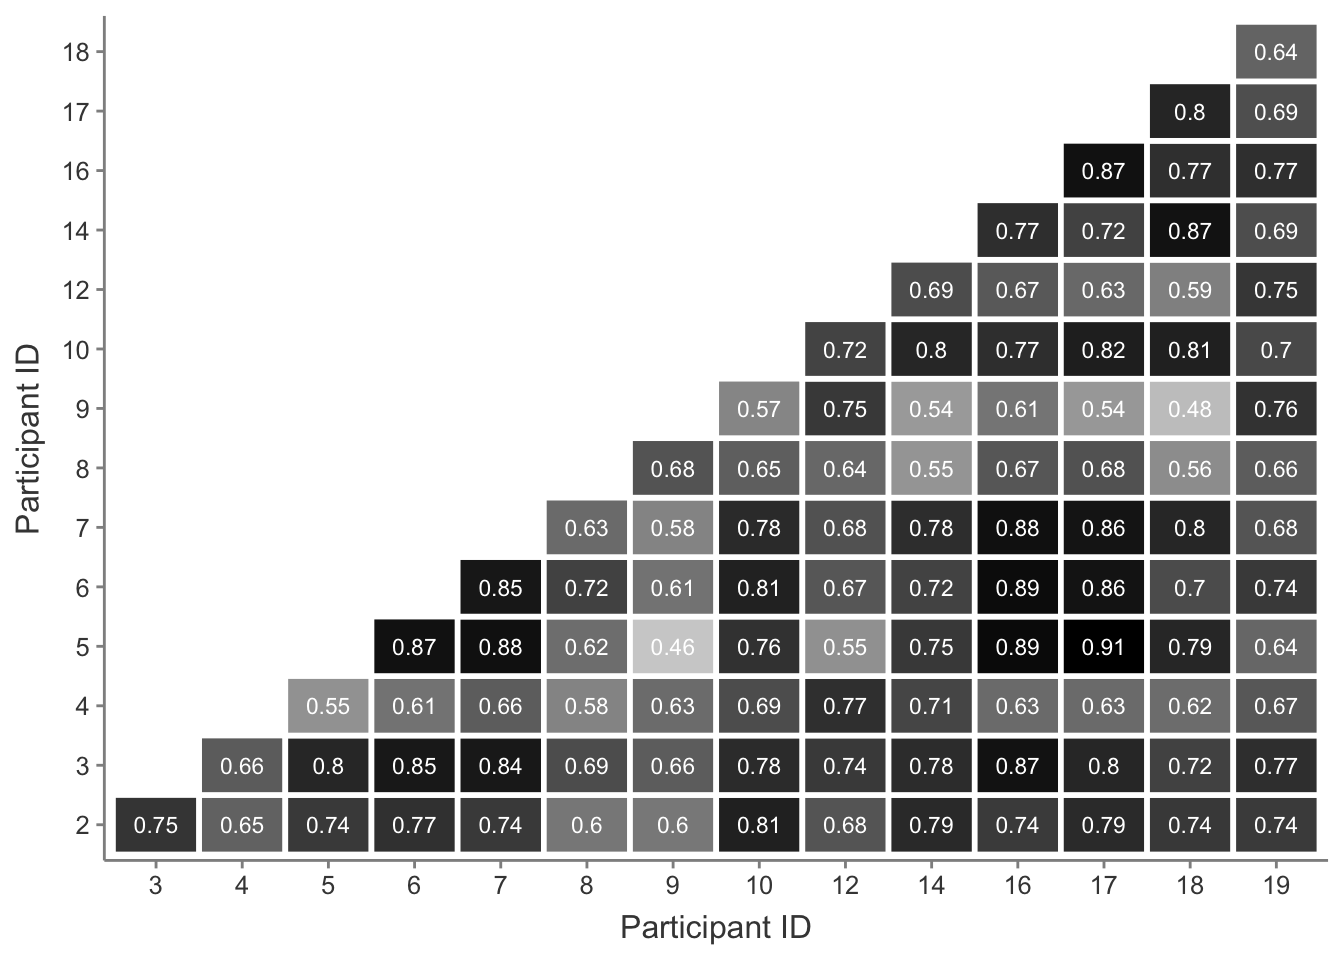
Figure A.1: Cosine similarity scores between all participant interview transcripts.
Cosine similarity results range from a minimum of 0.45 to a maximum of 0.91 similarity. Cosine similarity scores are defined as maximally similar at 1 (vectors have identical orientations) and maximally dissimilar at 0 (vectors are orthogonal). Results around 0.5 therefore show that while the texts may not be remarkably similar, they are also not drastically dissimilar. This would indicate that while some interviews were more similar than others, no participant drastically deviated in their responses. However it is worth noting where sources of dissimilarity may have arisen, which may be better illustrated by sub-dividing the similarity plot in Figure A.1 according to sub-groups within the participants.
A.1.1 Similarity amongst coaching experience levels
Participant 9 in particular appears to have the lowest similarity scores across the most number of comparisons. Participant 9 was the least experienced coach in the group with only 4 months of coaching experience and 2.5 years of parkour training at the time of their interview. It may be that coaching experience level plays a role in the responses given by participants. Cosine similarity scores sub-divided by approximations of coaching experience level are shown in Figure A.2.
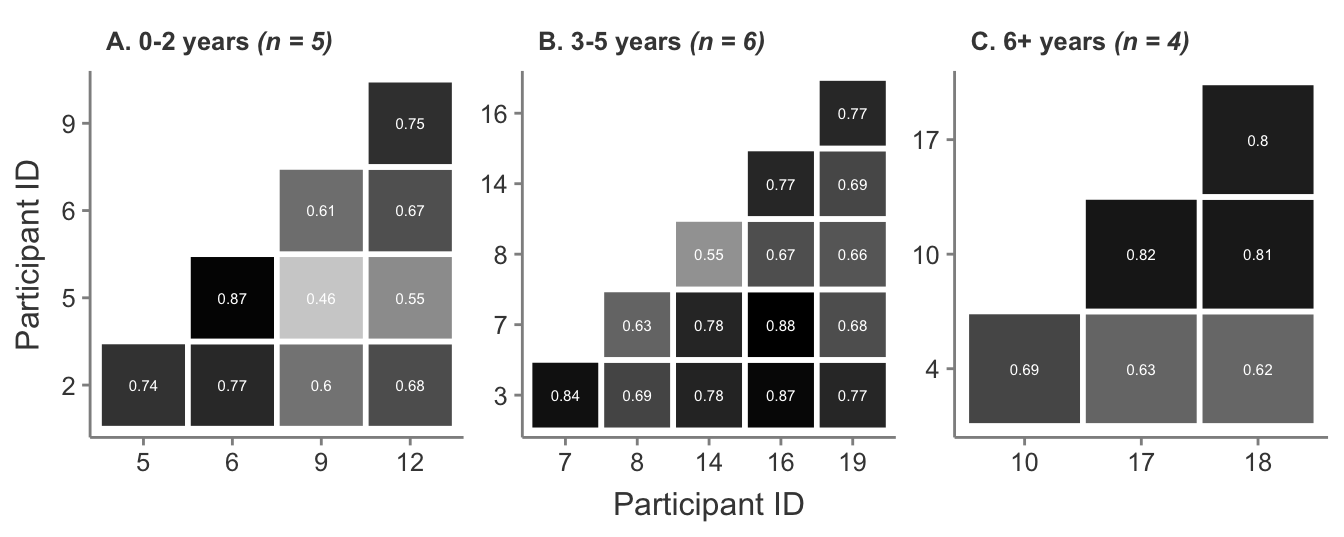
Figure A.2: Cosine similarity scores by coaching experience level between participant interview transcripts.
While similarity scores do differ amongst experience levels in Figure A.2, it can be seen that the lowest similarity score in each group rises (0-2 years = 0.46, 3-5 years = 0.55, 6+ years = 0.62) and the range of scores narrows (0-2 years = 0.41, 3-5 years = 0.33, 6+ years = 0.20) as coaching experience increases. It may be that, as coaches share understanding amongst their peers in the social milieu that the exchange of parkour coaching knowledge seems to predominantly take place in (Greenberg and Culver, 2020), they converge on a more common understanding of the kong vault movement over time. However the most experienced group also has the lowest maximum similarity score (0-2 years = 0.87, 3-5 years = 0.88, 6+ years = 0.82) that may, perhaps, indicate that while a general shared understanding may take place, coaches are still likely to develop their own ideas and understanding of the movement based on their experiences over time. Finally, the greatest similarity score in Figure A.1 does not occur when sub-dividing the participants by experience level, and instead occurs between participant 5 (0-2 years coaching experience) and participant 17 (6+ years coaching experience). Both participants 5 and 17 are female and from the USA; this may indicate that other factors influence similarity amongst responses.
A.1.2 Similarity amongst genders
Given the differences in experience learning and performing the kong vault described by female participants in Section 4.4, it may be worth considering the similarity between their responses independently of those given by male participants. Cosine similarity scores split by gender can be seen in Figure A.3 and clearly show a much stronger degree of similarity amongst responses given by female participants than males. This does not necessarily indicate dissimilarity between the responses given by male and female participants, but rather, that the experience amongst female parkour athletes and coaches appears to be more consistent than those amongst male athletes. This may simply be due to the greater number of male participants—consequently drawn from a more comprehensive array of backgrounds and experiences—taking part in both the wider sport and this particular study, but may also indicate some aspect of the typical female experience in learning, training, and coaching the kong vault that differs from the typical male experience.
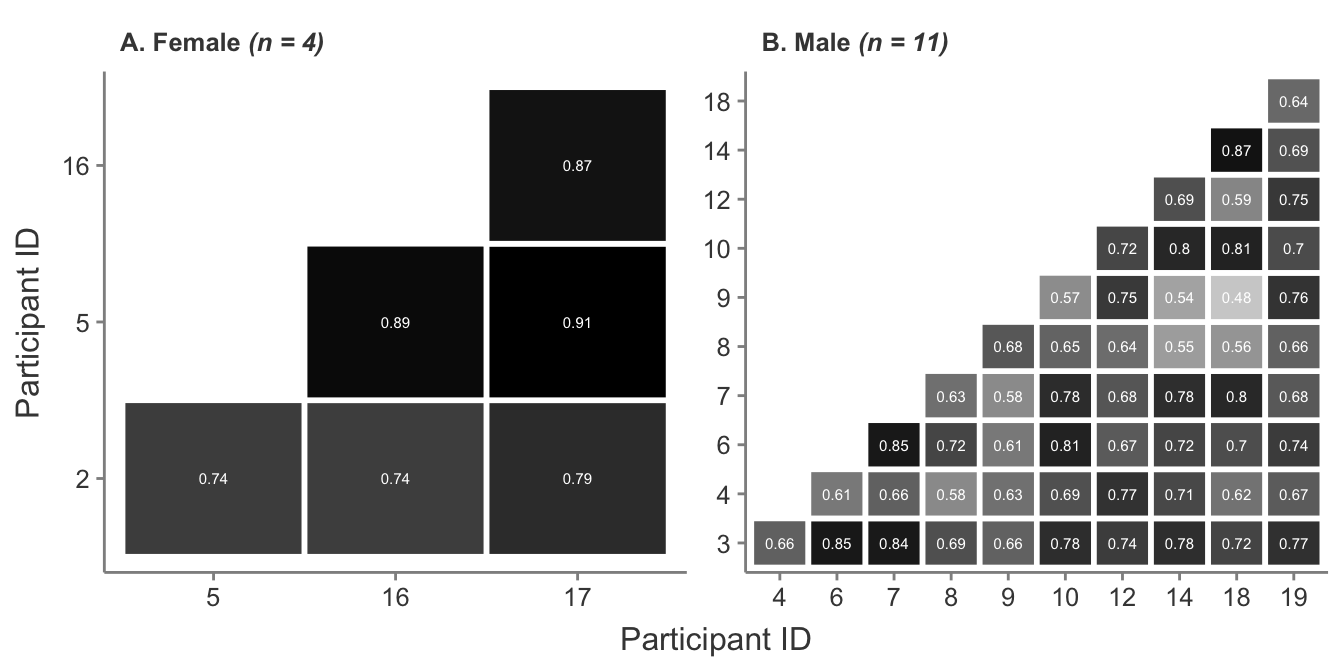
Figure A.3: Cosine similarity scores between all female and all male participant interview transcripts.
A.1.3 Similarity amongst countries
The role of geography may also be highlighted in Figure A.3 amongst female participants. Although still quite high, the similarity scores of participant 2 from the UK are lower than those between participants 5, 16, and 17 who are all from the USA. Similarly, participant 9 was the only participant from Norway, which may have influenced their sources of knowledge about the kong vault and their lower overall similarity scores when compared to other participants, as referenced previously. Figure A.4 shows the correlation scores between participants from the same country when more than one participant from a single country took part in the study. Correlation scores between participants who hailed from Slovakia and the UK were high, while those from the USA were more varied. This may be due to the greater size of the USA in comparison to the UK and Slovakia, with all American participants coming from different states. This may indicate that, where parkour communities can easily intermingle due to geographical proximity, a larger degree of similarity in their understanding of parkour movement may occur due to the more frequent cross-pollination of ideas and training methods.
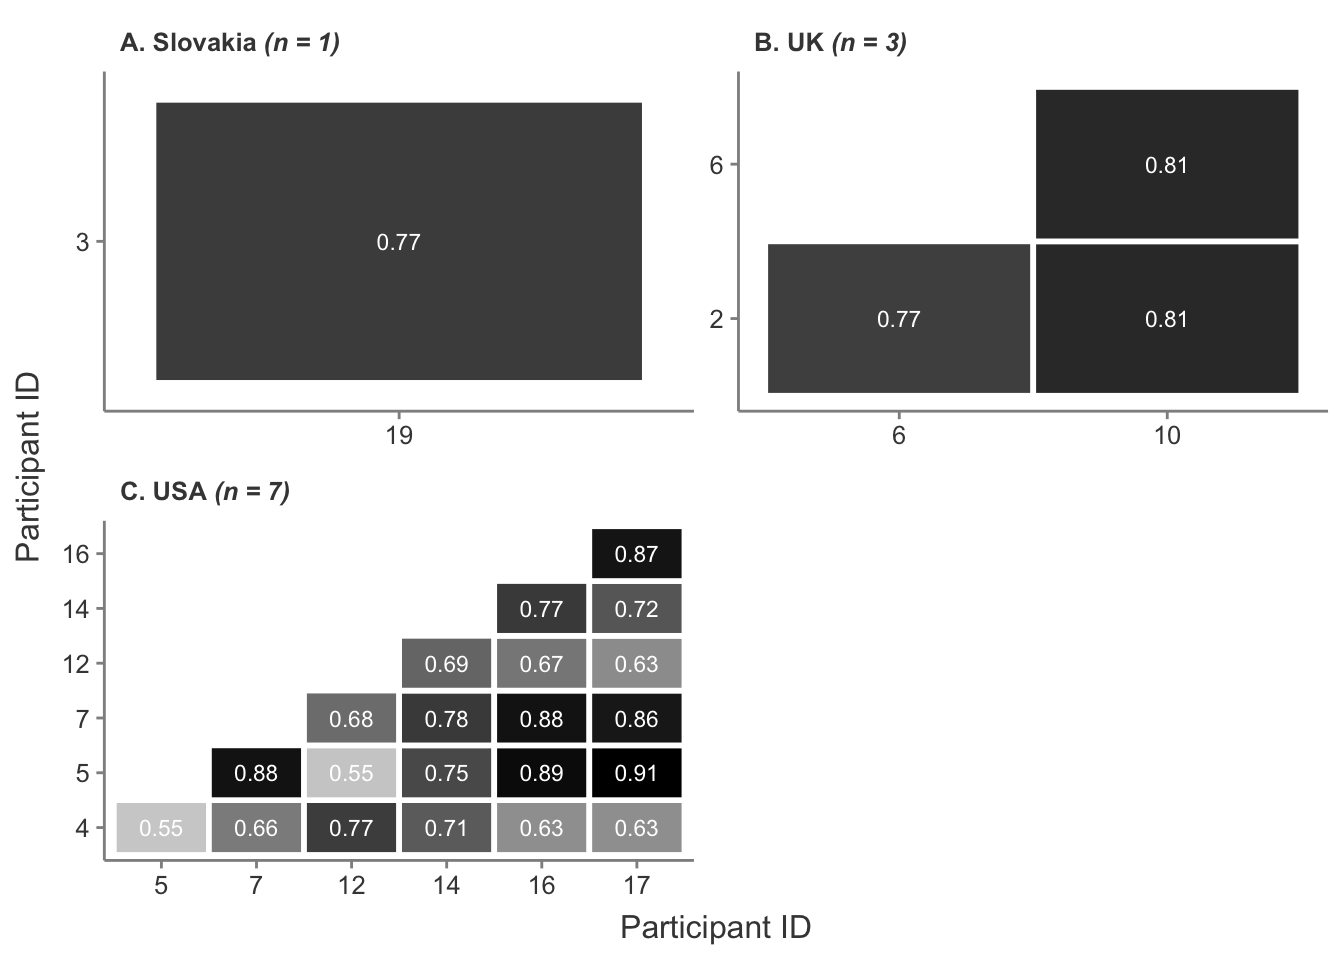
Figure A.4: Cosine similarity scores between interview transcripts by country where n > 1 participants from the same country took part.
A.2 Interview lengths and word counts
While cosine similarity calculates similarity regardless of text length, it can also be useful to consider the total number of spoken words and responses each participant gave in their interview to determine how interviews may differ from each other. Figure A.5 shows the total number of spoken words by each participant and the interviewer across all interviews, the average number of words spoken by participants and interviewer, and the number of question and response exchanges in each interview. It can be seen that the number of words spoken by the interviewer remained reasonably consistent across all interviews, with an average of 2,203 words spoken per interview.
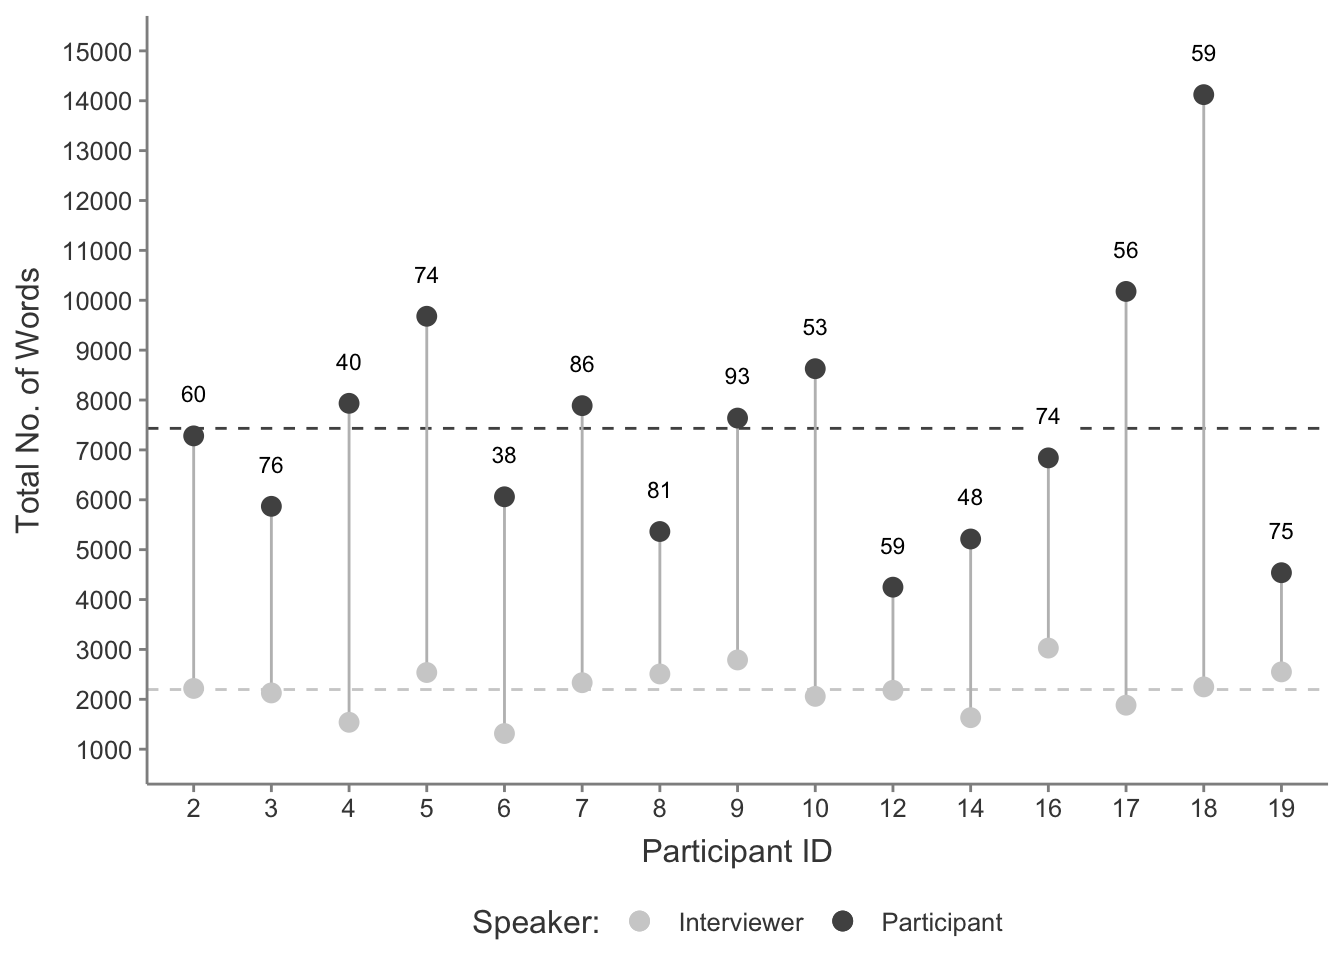
Figure A.5: Total word count per participant interview for both participant and interviewer. Number labels indicate number of question and response exchanges per interview. Dashed lines indicate the average interview word count for both participants and interviewer.
The number of exchanges and total participant word counts varied, with a range of 38 to 93 exchanges and 4,248 to 14,129 total words spoken by participants. It may be that a greater degree of prompting from more interview questions could be expected to increase the total number of words spoken by a participant. However the number of exchanges and total words spoken do not appear to strongly or significantly correlate at all (r = 0.08, t(13) = -0.29, p = 0.78, see Figure A.6), indicating some participants provided many short responses while others gave longer answers to a similar number of exchanges, and vice-versa.
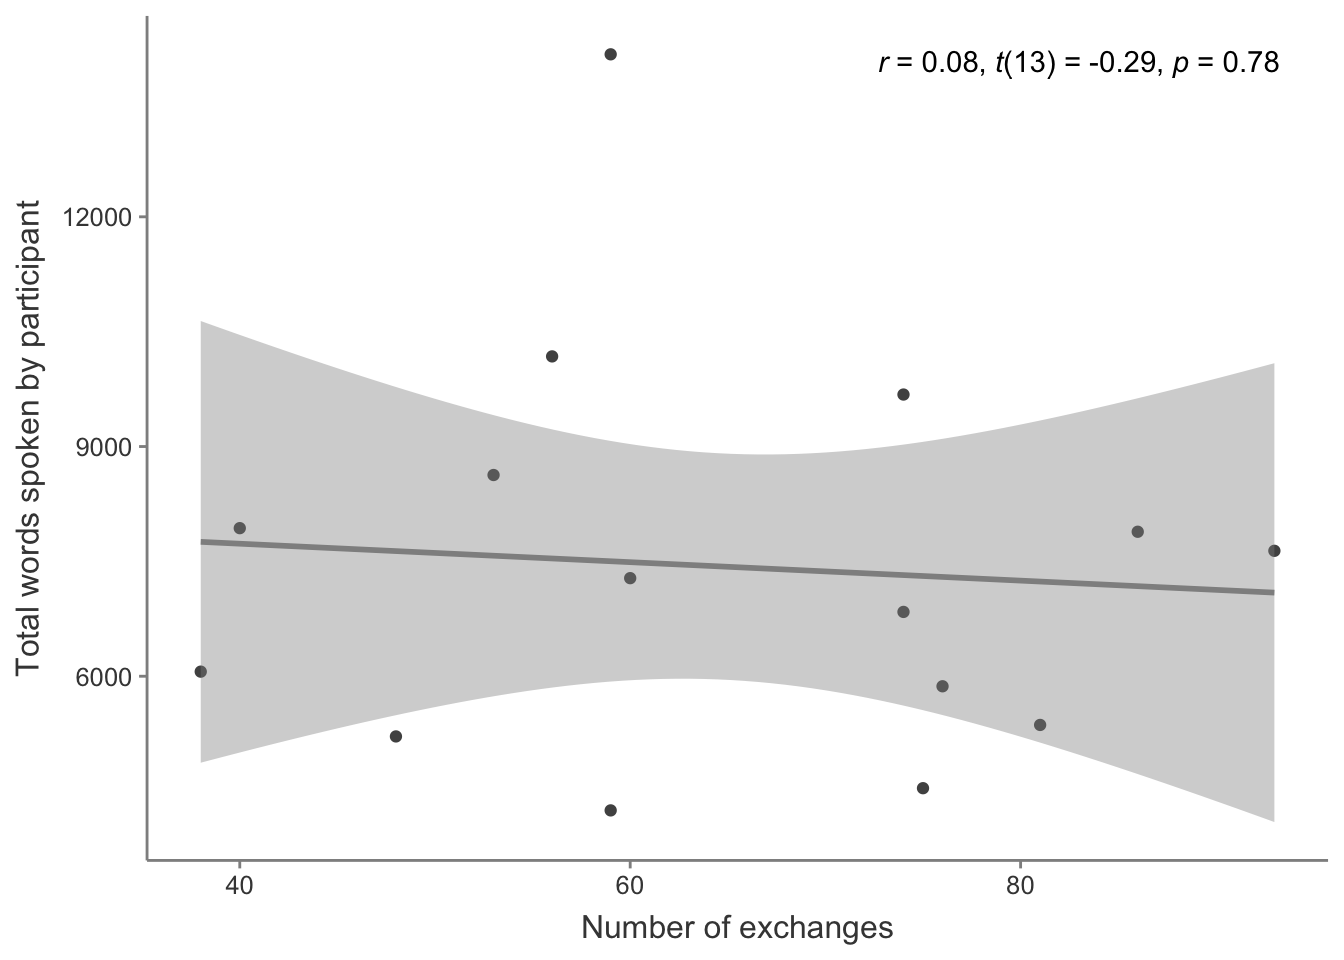
Figure A.6: Correlation plot between the number of question and response exchanges and the total number of words spoken by a participant.
Interviewer consistency can further be assessed by returning briefly to cosine similarity as in Section A.1, but analysing only the questions asked by the interviewer in place of the responses given by participants. Cosine similarity for interviewer text only is shown in Figure A.7 and show a high degree of similarity amongst the questioning of all participants, with only two comparisons scoring below 0.80 cosine similarity with scores of 0.78 each. It seems that the interviewer was consistent in their questioning of participants, and that variation in interview length was a result of the characteristic verbosity or brevity of individuals rather than receiving more or less engagement or prompting from the interviewer.
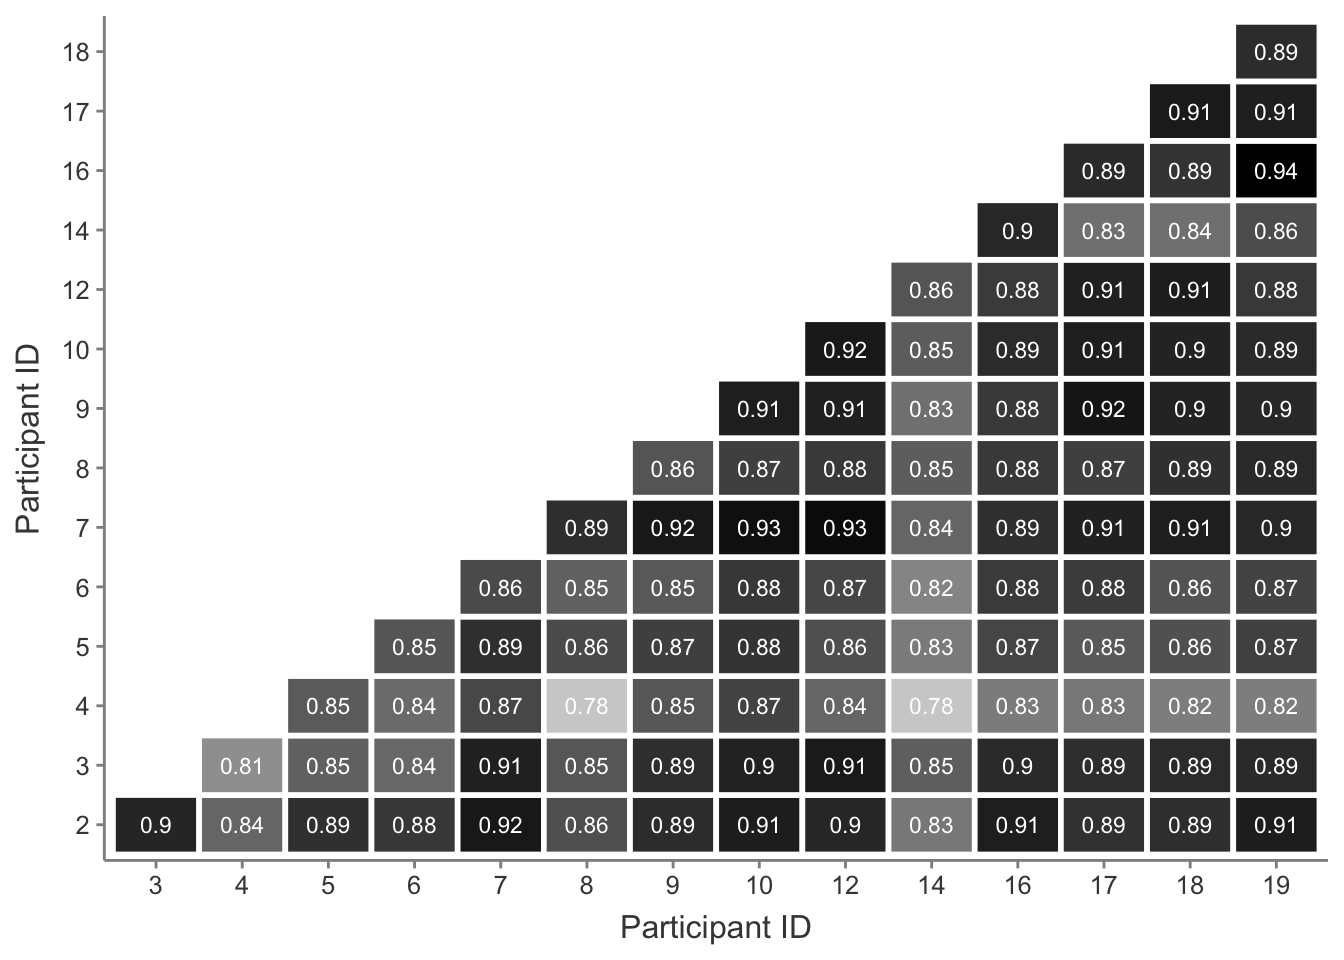
Figure A.7: Cosine similarity scores between all interviewer questions across all interview transcripts.
A.3 Sentiment analysis
Sentiment analysis of the interview transcripts provides a way to understand any emotionality attached to the responses given. It could be expected that not a lot of emotion may be expressed given the subject matter, but topics on learning and coaching may also cross into psychological or sociological areas that may involve discussing the feelings of participants during those experiences.
To perform sentiment analysis, the text of each interview is first tokenised, as discussed in Section A.1. However, instead of tokenising at the text or sentence level the text is tokenised per response. Each response is then passed through a sentiment analysis algorithm (Rinker, 2017) that assigns a sentiment score (-1 for negative sentiment or +1 for positive) to each word in the response. The algorithm also considers each word in context for valence shifters that may flip the sentiment of a word—for example, “I like it” may score “like” as positive but the sentence “I don’t like it” will score it as negative. The average sentiment score for each response is then calculated.
Sentiment scores smoothed across entire interviews are presented in Figure A.8. As expected, sentiment remains fairly neutral throughout all interviews, on average failing to exceed a sentiment score of 0.4. All interviews remain overall positive throughout.
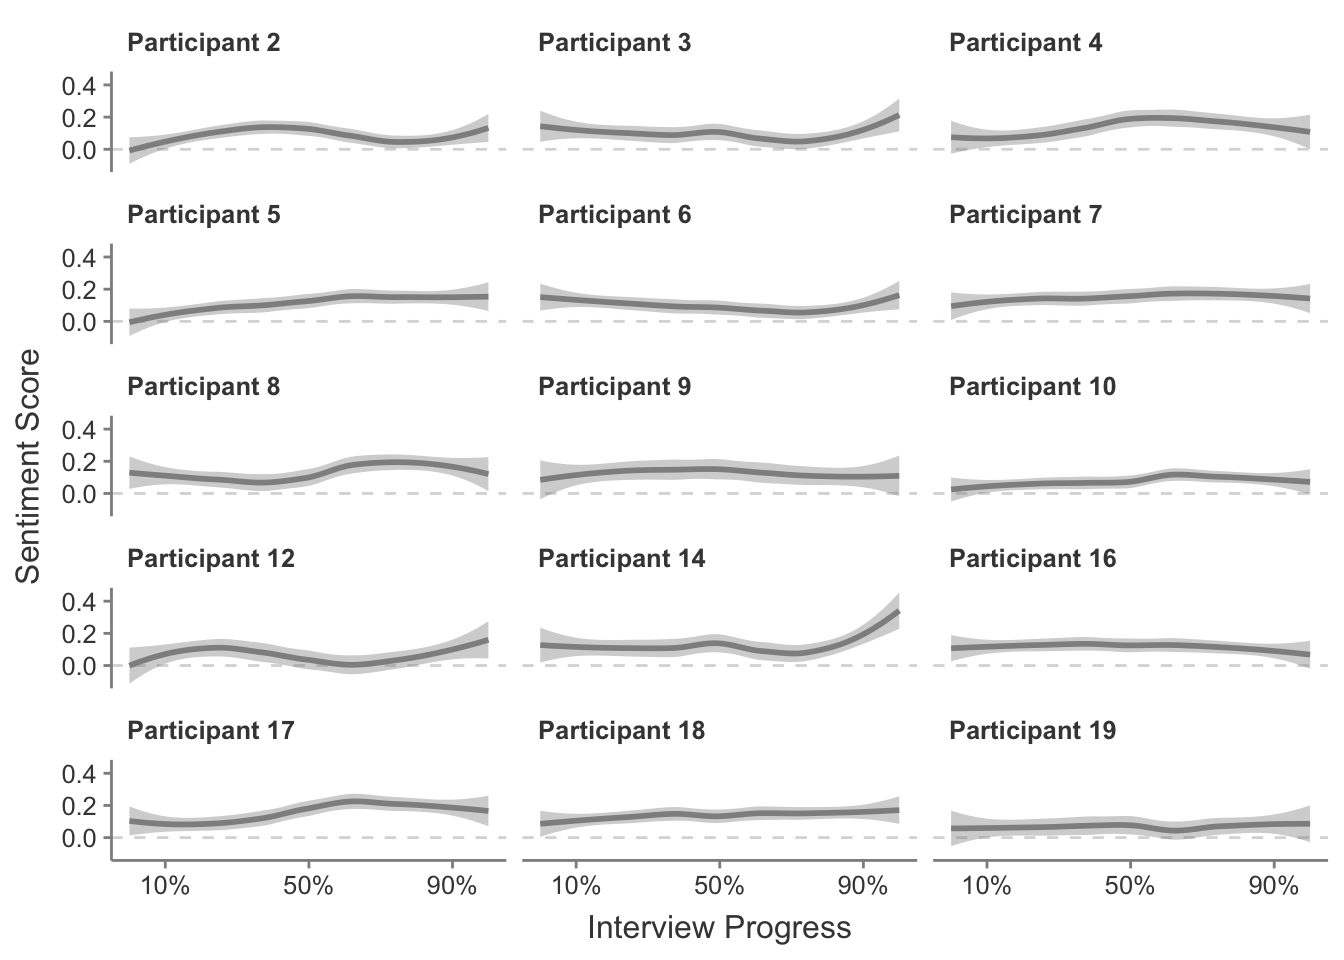
Figure A.8: Sentiment scores for each participant interview, smoothed.
For a more granular inspection of the sentiment scores, individual response sentiment scores can be plotted without averaging across the entire interview. These scores are shown in Figure A.9. Individual responses contain a higher degree of sentiment, and there are also some negative spikes of sentiment sporadically throughout. As the overall interview sentiment remains positive, it may be worth isolating some of the few identified negative responses to consider their contents.
When considering the text of the negative responses given, most relate to some unfortunate side-effect of the interview process, such as experiencing a disconnect in the video calling software used or a response being labelled as unclear. Those few responses that appear to genuinely relate to questions all use the words ‘fear’, ‘apprehension’, or ‘mistake’ in relation to issues around performing a kong vault, which are understandably negative sentiments. However these also usually concern the student experience rather than coach, particularly beginner-level students as they first learn the movement, and form a small part of the overall discussion. It appears that parkour coaches predominantly feel positively about the kong vault, although perhaps not strongly so.
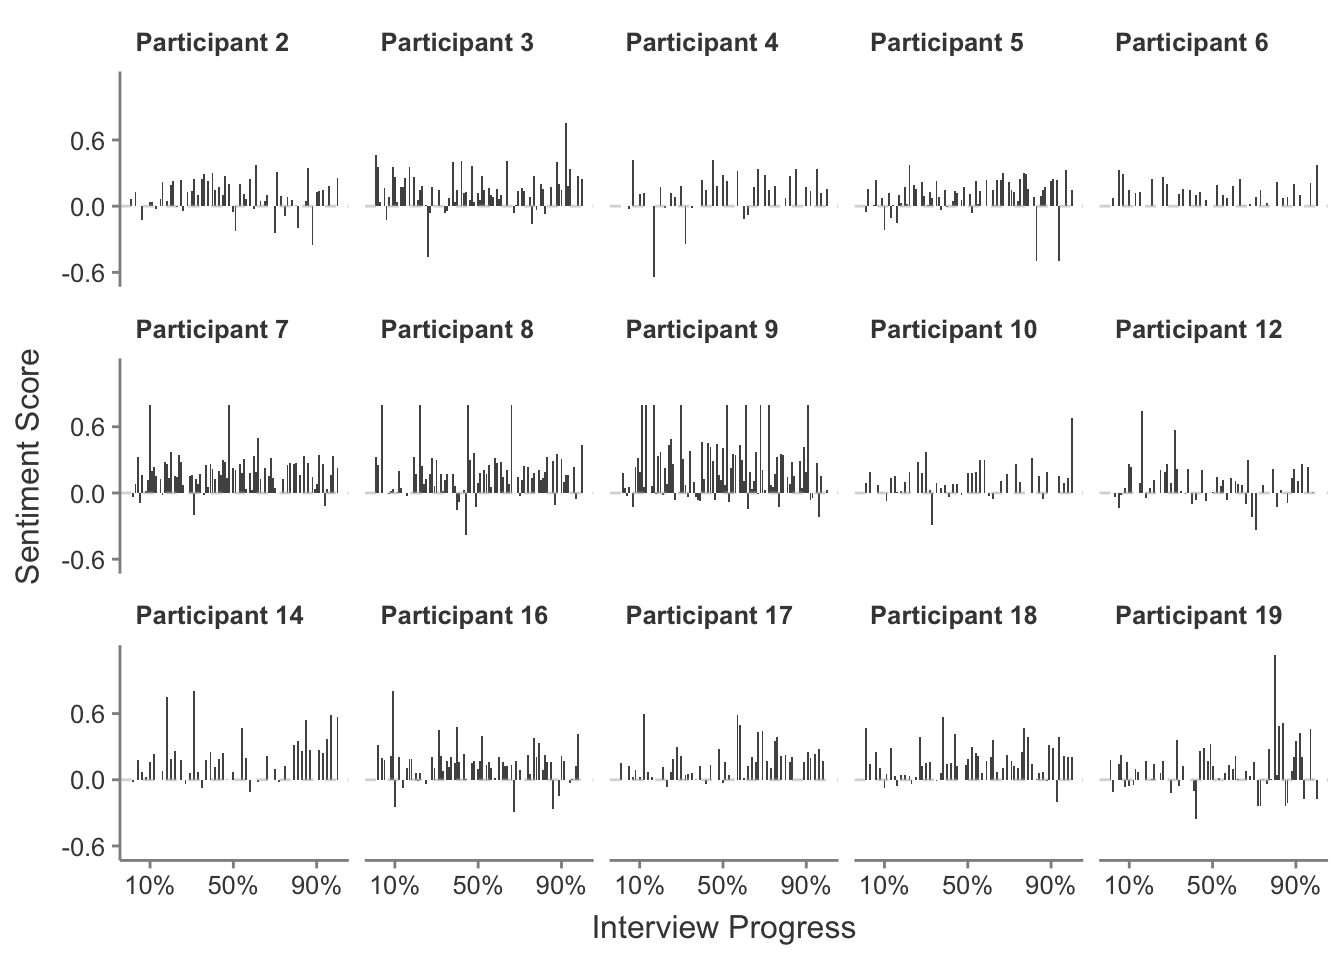
Figure A.9: Sentiment scores for each response given by a participant in their interview.
A.4 Commonly occurring associations between words
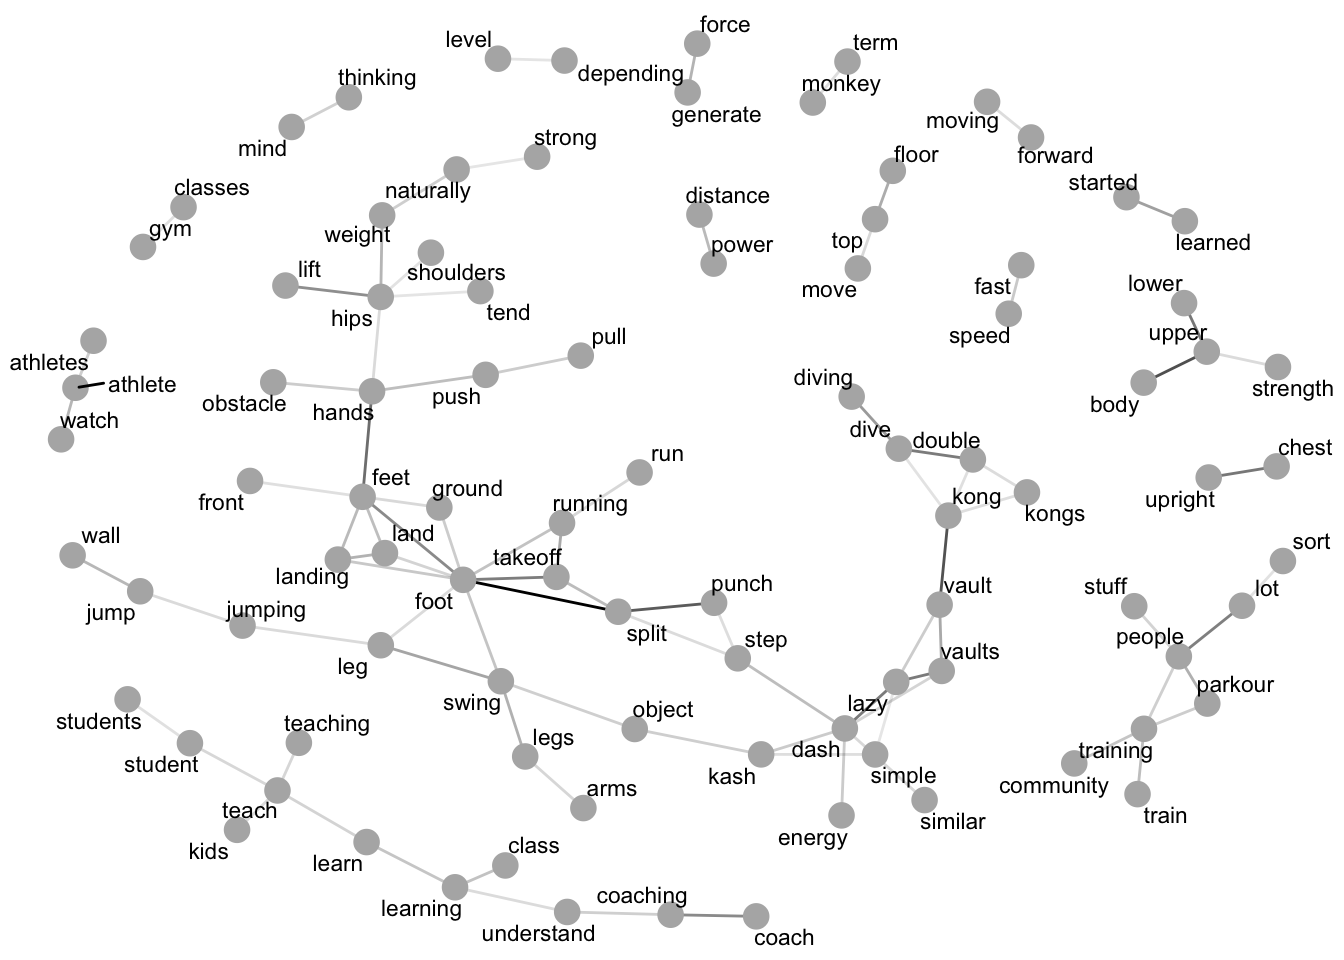
Figure A.10: Commonly associated words from all participant interviews.
Finally, a network graph of common word associations found across all interviews can be used to determine how words that frequently appear together may be related. Figure A.10 shows a network graph of common word associations identified from participant interviews. There are two large clusters of words, one relating to direct descriptions of the kong vault and one seemingly related to learning and coaching, along with some smaller independent clusters. Some connections between certain words in particular may prompt further interest:
- The association between the words ‘power’ and ‘distance’ seem to imply a relationship is perceived between those terms in the understanding of the kong vault by parkour coaches and supports the ideas put forward for investigation in future studies detailed in Section 4.4.
- The association of the words ‘upright’ and ‘chest’ link to the positioning of the body on exiting the kong vault, and as the only word associated with ‘chest’, ‘upright’ appears to be the predominant focus of body repositioning to take place. Given the diving nature of the kong vault this may be expected, as reorientating oneself upright is a necessary key component of exiting the vault when aiming to land with the feet. This is also potentially reflected in the association of the words ‘feet’ and ‘front’, as although these are not connected to chest or upright, returning the feet to a position in front of the body is another necessary key component for reorientation from the dive phase of the kong vault.
- Similarly, ‘hips’ and ‘lift’ indicate the role of the hips during the movement, and in particular link to the words ‘weight’, ‘naturally’, and ‘strong’. This association through the word weight to the word strong could result from the issues described in Section B around gender weight distribution and strength differences and the role they play in the kong vault.
- The association between the words ‘upper’ and ‘strength’ may imply that upper body strength is considered more of a topic related to the kong vault, although ‘upper’ itself is also immediately associated with the word ‘lower’ perhaps indicating that strength in both the upper and lower body are jointly of concern.
- ‘Pull’ and ‘push’ both being directly associated along with the word ‘hands’ may reflect the uncertainly in the role of the hands on the obstacle during the kong vault movement expressed in Section 4.1.2.2.
- The word ‘similar’ associating with the word ‘dash’ may indicate the degree to which the dash vault is considered the most similar of the vaults to the kong vault as a hands-only bilateral vault, or potentially due to its role in the hybrid kash vault movement.
A.5 Summary
Cosine similarity scoring shows that responses varied in their similarity but were more consistently similar amongst more experienced coaches, female participants, and participants from similar geographical locations. Interviewer questioning was consistent in similarity across all interviews, with overall interview length seemingly unrelated to any influence of the interviewer. Sentiment analysis shows that parkour coaches overall feel positively about the kong vault, although not strongly so, with negative sentiment expressed mainly in relation to any fear or apprehension felt during the initial learning process of the movement. Common word associations were plotted and features identified relating to potential enquiries for future study, namely the relationship between power and distance in the kong vault, the overall role of the upper body in the movement, and the different experiences of the vault between genders. The consistency of interview questioning and responses support the use of the data collected in providing an overview of the understanding of the kong vault amongst parkour coaches, with the common word associations found also acting as further prompts for possible future biomechanical studies into the vault.