

(Tidy Tuesday is a project to supply weekly data sets for R users to practice their coding skills on. You can find full details here.)
The Tidy Tuesday dataset for this week, compiling meteorite strikes across the world, grabbed my interest so I decided to finally dive in and give it a go. I ended up looking at strikes in the UK, noted by mass.
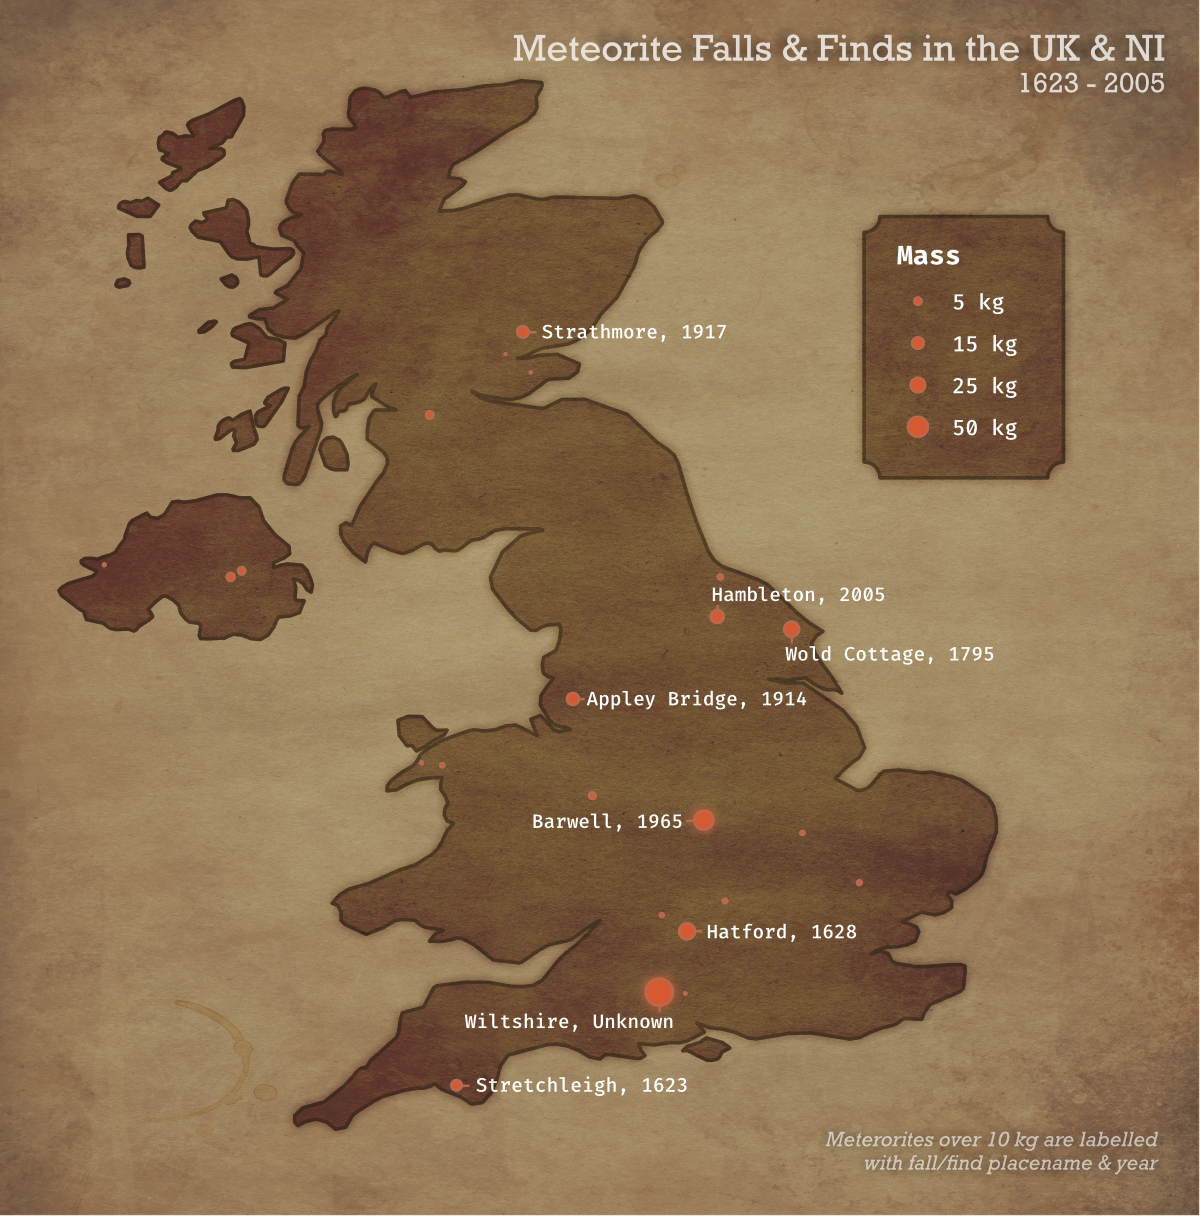
I exported the original code image as a PDF and then applied some effects in Affinity Photo to give it an old, weathered look. This was my first time experimenting with something like this, so it’s a little sketchy, but I enjoyed seeing how I could pull a plot apart in Photo to apply image effects (although sorry, this does mean the code for this plot doesn’t get you all the way to the finished produced).
Code:
library(tidyverse)
library(maps)

meteorites <- readr::read_csv("https://raw.githubusercontent.com/rfordatascience/tidytuesday/master/data/2019/2019-06-11/meteorites.csv")

ukFalls <- meteorites %>%
  filter(lat >= 50 & lat <= 60 & long <= 2 & long >= -11) %>%
  filter(!name %in% c("Limerick", "Dundrum", "Mooresfort", "Leighlinbridge", "Pettiswood")) %>%
  mutate(massKG = mass/1000) %>%
  mutate(nameYear = paste(name, year, sep = ", ")) %>%
  arrange(year)

ukMap <- map_data(regions = "uk", map = "world") %>% filter(lat <=58.73)

ggplot(ukMap, aes(x = long, y = lat)) +
  geom_polygon(aes(group = group), colour = "black", fill = "#222831") +
  geom_point(data = ukFalls, aes(x = long, y = lat, size = massKG), colour = "#d65a31") +
  geom_text(data = subset(ukFalls, massKG >=10), aes(label = nameYear), hjust = 0, nudge_x = 0.2, size = 3) +
  scale_size(range = c(0, 5), breaks = c(5,15,25,50), labels = c("5 kg", "15 kg", "25 kg", "50 kg")) +
  theme_void() +
  theme(plot.background = element_rect(fill = "#5588a3"),
        plot.margin = margin(.5, .5, .5, .5, "cm")) +
  labs(size = "Mass",
       alpha = "Mass")

ggsave("map.pdf")
