2 Method
2.1 Participants
Following ethical approval by the London Metropolitan University School of Human Sciences Research Ethics Review Panel and *a priori* power analysis (α = 0.05, β = 0.8, η2p = 0.6), 10 parkour practitioners were recruited for this study. All participants were screened for contraindications or injuries and required a minimum of 2 years experience in parkour training (Puddle and Maulder, 2013). Participants completed a CSEP Get Active Questionnaire (Canadian Society for Exercise Physiology, 2017) and informed consent forms following a full explanation of the study aims and protocol.
Participant characteristics are reported in Tables 2.1 and 2.2.
| Mean ± SD | |
|---|---|
| Age (yrs) | 29.4 ± 7.18 |
| Height (cm) | 173.81 ± 8.05 |
| Weight (kg) | 74.22 ± 8.35 |
| Years Training (yrs) | 9.7 ± 3.62 |
| Left Foot | Right Foot | |
|---|---|---|
| Male | 6 | 2 |
| Female | 0 | 2 |
2.2 Protocol
Participants were instructed to attend in comfortable athletic clothing and footwear that they would normally wear for parkour training. Height was measured using a stadiometer (Leicester Height Measure, Chasmors Limited, UK) as per protocol in Milašinović et al. (2016). Weight and GRF data was measured using a force platform (Kistler Type 9826AA, Kistler Instrumente AG, Switzerland), connected to BioWare software (type 2182A, version 5.3.0.7).
Movements were carried out using a vaulting box (Niels Larsen Ltd, UK) with a height of 0.96 m and a depth of 0.55 m. The force platform was placed on a solid floor surrounded by rubber mats to create a landing runway extending 3 m away from the vaulting box to minimise any risk of injury if landing off-target. Force plate data were collected for 8 seconds per trial at a sampling rate of 1000 Hz (Linthorne, 2001).
Participants were given time to warm up and to practise each movement with each landing style onto the force plate as they desired and until the satisfaction of researchers that all movements were being performed as required. Participants performed 8 movements in a sequence, consisting of a drop landing and three PKVs each executed with a two-legged stop landing (precision landing) and a single-legged landing with the preferred leg that continued into a short run (running landing). Sequences were generated and assigned using a randomised Latin square of movement combinations and a random number generator. Movement order within each sequence was arranged in a counter-balanced crossover design to mitigate fatigue and learning effects (Moir et al., 2004). This was repeated for a total of 3 sequences, or 24 total movements, per participant.
Each participant was allowed a run-up distance comfortable to them for typical execution of each movement, mimicking field conditions (Gratton and Jones, 2010). Movements were deemed unsuccessful if the participant performed the movement and did not land, or landed only partially, on the force plate. Unsuccessful movements were repeated until successful. A 30-second rest was given between movements within a sequence and a 2-minute rest between sequences. All participants completed all their sequences in a single testing session.
Movements were performed as follows:
Drop landing: the participant crouched to full depth atop the vaulting box before dropping to the force platform.
Step vault: the participant jumped at the box and used one hand and the contralateral foot in contact with the box, with the non-contact foot stepping through before leaving the box, as illustrated in Figure 2.1.
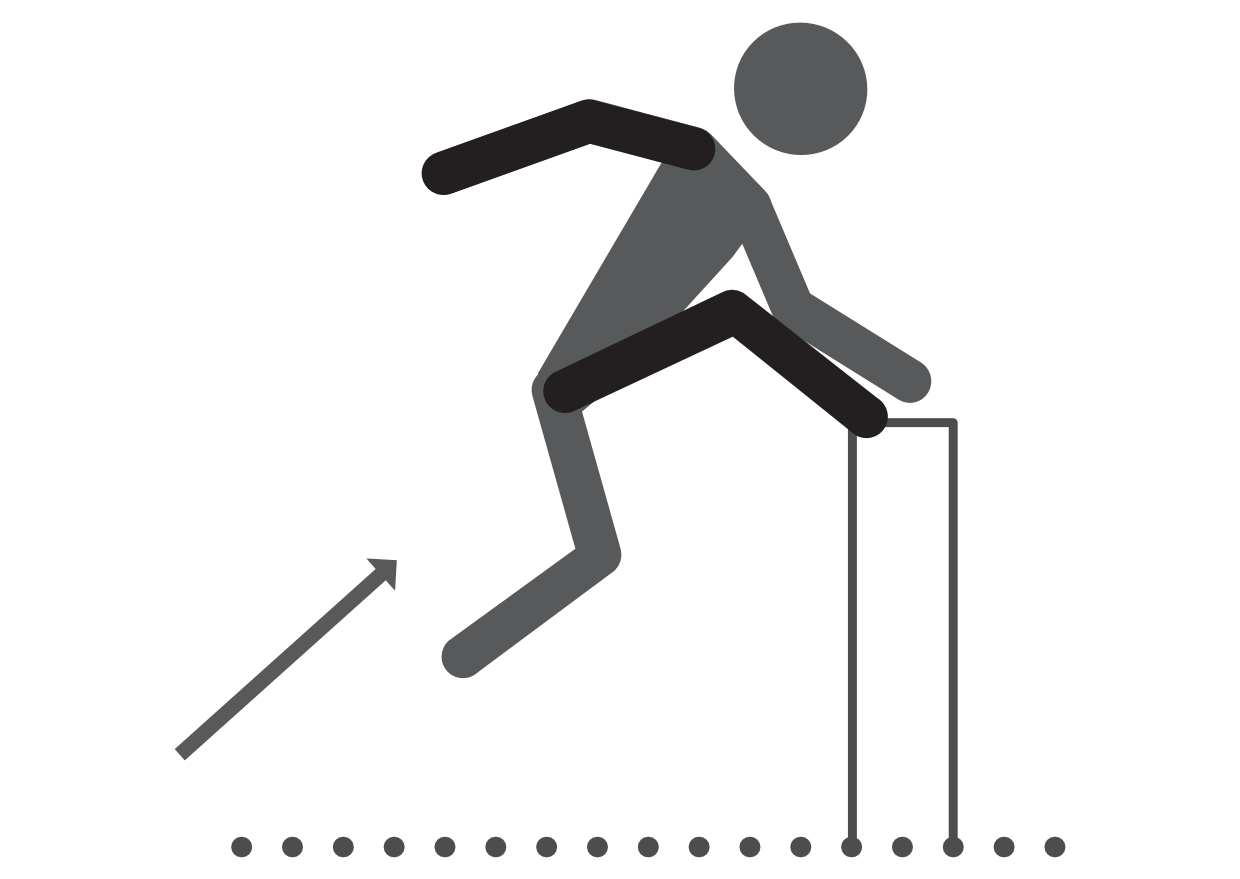
Figure 2.1: Illustration of a step vault.
Kong vault: the participant dived forward with their hands first, placing both hands atop the box simultaneously whilst in the air. The hands pushed off as the knees tucked into the torso and the body followed over the box, as illustrated in Figure 2.2.
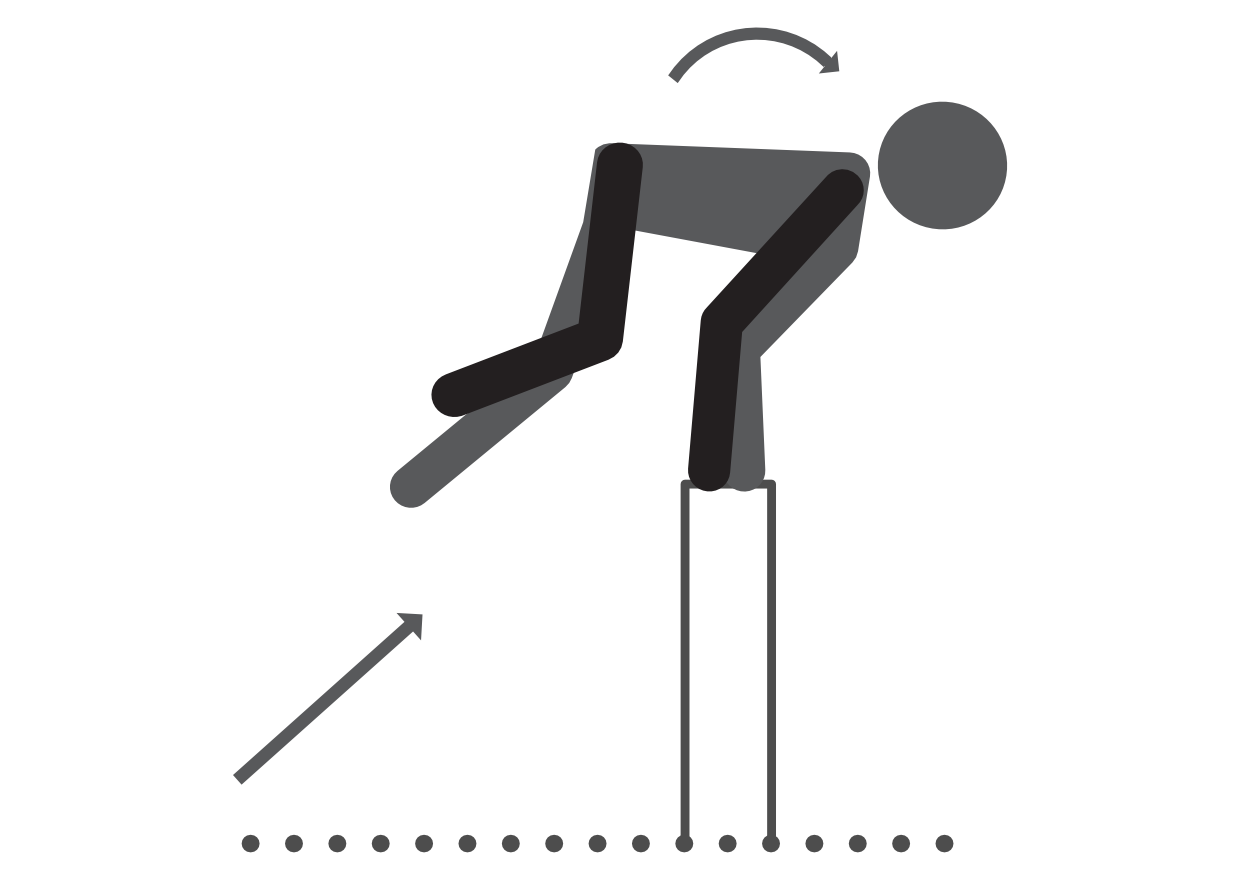
Figure 2.2: Illustration of a kong vault.
Dash vault: the participant jumped at the box feet first, with the feet passing over and both hands coming down to push off the box from behind the body, as illustrated in Figure 2.3.
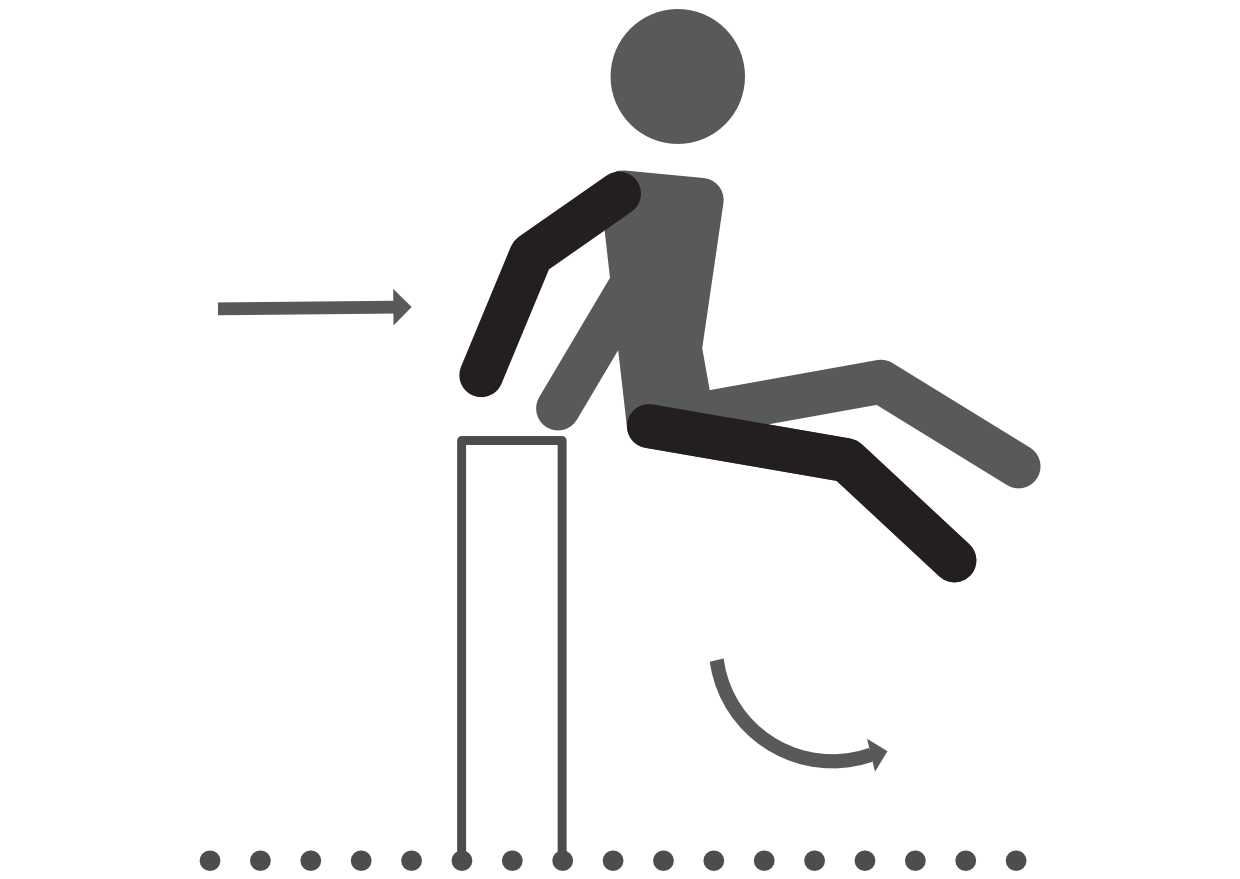
Figure 2.3: Illustration of a dash vault.
2.3 Statistical analysis
GRF data for each movement in both vertical and anterior-posterior axes was exported from Bioware to tab-delimited text files and imported into R (version 3.5.1) in RStudio (version 1.2.1335). For each movement, peak vertical force was determined as the maximum force output recorded in the vertical axis and peak braking force as the maximum positive force recorded in the horizontal axis. Force measurements in Newtons were standardised to multiples of body weight using the formula
\[ Force\ (BW) = \frac{Force\ (N)}{Body weight\ (N)} \]
For precision style landings, force figures were then halved to obtain estimates of the peak force experienced by a single limb during each landing (Jensen and Ebben, 2007). The median value of the three repetitions of each movement and landing style for each participant was calculated to form the final dataset for analysis. Normality for each movement and landing style combination within each dependent variable was tested using a Shapiro-Wilk test. Time series data for all trials were normalised using interpolation for the impact phase (defined as the time from contact with the force plate to leaving the force plate or achieving a return to bodyweight levels for the single foot and double foot landings respectively) for graphical representation only.
All statistical analyses were performed using R (version 3.5.1) in RStudio (version 1.2.1335). Results were analysed using a two-way repeated-measures analysis of variance (ANOVA) for each dependent variable to examine the effect of movement choice and landing style. Sphericity was checked with Mauchly’s test and, if failed, a Greenhouse-Geisser correction was applied. Simple effects analysis was performed for significant interactions by comparing means of groups from one term at all levels of the second term with a pairwise comparison test using a Holm-Bonferroni adjustment. Significance for all tests was set at α = 0.05. Partial eta-squared (η2p) was calculated for ANOVA effect sizes and Cohen’s d with Hedge’s correction g was calculated for all pairwise comparisons. η2p and g effect sizes were interpreted using recommendations by Lakens (2013).
Intraclass correlation coefficient (ICC) estimates between repetitions for each participant in each dependant variable were calculated using the IRR package (Gamer et al., 2019) based on a single measurement, absolute agreement, 2-way mixed-effects model (Weir, 2005). ICC results were interpreted using recommendations by Koo and Li (2016).