3 Results
ICCs for each dependent variable across all movements are reported in Figure 3.1. Moderate to good reliability was found for all combinations except drop (ICC = 0.41, p = 0.021) and dash (ICC = 0.29, p = 0.059) running style landings for peak vGRF, and dash (ICC = 0.49, p = 0.007) and kong (ICC = 0.30, p = 0.033) precision landings in peak bGRF.
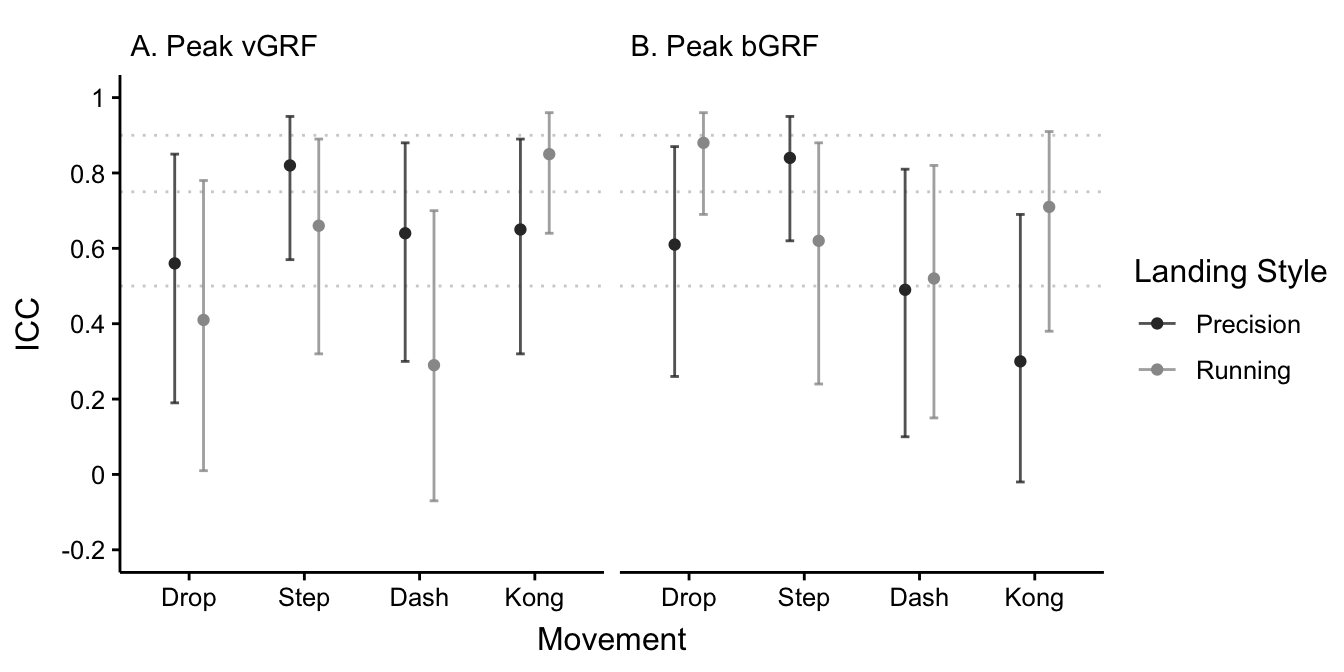
Figure 3.1: Intraclass correlation coefficients for peak vertical (A) and braking (B) ground reaction forces for all movement and landing style combinations using a single measurement, absolute agreement, 2-way mixed-effects model. Error bars represent 95% confidence intervals. Horizontal dashed lines represent 0.5 (moderate), 0.75 (good), and 0.9 (excellent) reliability as per Koo and Li (2016).
Results from the two-way repeated-measures ANOVA are reported in Table 3.1. A significant interaction effect between movement choice and landing style was found for peak vGRF (F3, 27 = 4.98, p = 0.007, η2p = 0.36) and peak bGRF (F3, 27 = 12.00, p < 0.001, η2p = 0.57). The main effect of movement choice was found to be highly significant for peak vGRF (F3, 27 = 14.14, p < 0.001) and peak bGRF (F3, 27 = 36.81, p < 0.001), but with a larger effect size on bGRF (η2p = 0.80) than vGRF (η2p = 0.61). The main effect of landing style was significant for vGRF (F1, 9 = 136.60, p < 0.001) with a large effect size (η2p = 0.94), but was not significant for bGRF (F1, 9 = 0.10, p = 0.758) alongside a very small effect size (η2p = 0.01).
| Measure | Effect | DFn | DFd | F | p | np2 |
|---|---|---|---|---|---|---|
| Peak vGRF | ||||||
| Vertical Peak | Movement | 3 | 27 | 14.137 | < 0.001* | 0.61 |
| Landing Style | 1 | 9 | 136.589 | < 0.001* | 0.94 | |
| Movement:Landing Style | 3 | 27 | 4.979 | 0.007* | 0.36 | |
| Peak bGRF | ||||||
| Horizontal Peak | Movement | 3 | 27 | 36.811 | < 0.001* | 0.80 |
| Landing Style | 1 | 9 | 0.101 | 0.758 | 0.01 | |
| Movement:Landing Style | 3 | 27 | 12.002 | < 0.001* | 0.57 | |
Results from pairwise comparison testing on the effect of switching landing style within each movement are reported in Table 3.2. All movements significantly increased in peak vGRF with a large effect size when switching from precision to running landings. The step (t = 3.37, p = 0.025, g = 0.97) and dash (t = 6.10, p = 0.001, g = 1.76) vaults both significantly decreased in peak bGRF with a large effect size when switching from precision to running landings, while the drop and kong vault did not differ significantly in peak bGRF between landing styles.
| Movement | Diff. (BW) | t | p | g |
|---|---|---|---|---|
| Peak vGRF | ||||
| Drop | -1.64 | -19.42 | < 0.001* | -5.61 |
| Step | -1.10 | -6.72 | < 0.001* | -1.94 |
| Dash | -0.82 | -5.29 | 0.002* | -1.53 |
| Kong | -1.68 | -5.32 | 0.002* | -1.54 |
| Peak bGRF | ||||
| Drop | -0.06 | -1.24 | 0.246 | -0.36 |
| Step | 0.05 | 3.37 | 0.025* | 0.97 |
| Dash | 0.15 | 6.10 | 0.001* | 1.76 |
| Kong | -0.10 | -1.96 | 0.163 | -0.57 |
Results from pairwise comparison testing on the effect of switching movement within each landing style are reported in Table 3.3. The kong vault was significantly greater in peak vGRF and bGRF than all other movements when using a precision landing. With a running landing, the kong vault produced significantly greater peak bGRF than all other movements, but only significantly greater peak vGRF than the dash vault (t = -3.71, p = 0.024, g = -1.07). Though significant difference was not found, the kong vault still produced medium effect sizes on peak vGRF in comparisons to the drop (g = -0.71) and step (g = -0.86) vault with a running landing.
The dash vault did not significantly differ from any movement with a precision landing other than the kong vault in either dependent variable. When using a running landing, the dash vault produced significantly lower peak bGRF than all other movements and significantly lower peak vGRF than the drop (t = 4.11, p = 0.016, g = 1.19) and kong vault, all with large effect sizes. The step vault was not found to significantly differ from the drop in any dependent variable in either landing style, although the effect size on peak vGRF when using a running landing was medium (g = 0.72) while all other effect sizes were small to negligible.
| Step | Dash | Kong | Step | Dash | Kong | |
|---|---|---|---|---|---|---|
| Peak vGRF | ||||||
| Drop | Δ = -0.02 | Δ = 0.03 | Δ = -0.56 | Δ = 0.52 | Δ = 0.86 | Δ = -0.60 |
| t = -0.25 | t = 0.27 | t = -5.94 | t = 2.49 | t = 4.11 | t = -2.45 | |
| p = 1.000 | p = 1.000 | p = 0.001* | p = 0.104 | p = 0.016* | p = 0.104 | |
| g = -0.07 | g = 0.08 | g = -1.72 | g = 0.72 | g = 1.19 | g = -0.71 | |
| Step | Δ = 0.05 | Δ = -0.54 | Δ = 0.34 | Δ = -1.12 | ||
| t = 0.84 | t = -8.91 | t = 1.40 | t = -2.97 | |||
| p = 1.000 | p < 0.001* | p = 0.194 | p = 0.063 | |||
| g = 0.24 | g = -2.58 | g = 0.41 | g = -0.86 | |||
| Dash | Δ = -0.59 | Δ = -1.45 | ||||
| t = -5.61 | t = -3.71 | |||||
| p = 0.001* | p = 0.024* | |||||
| g = -1.62 | g = -1.07 | |||||
| Peak bGRF | ||||||
| Drop | Δ = -0.02 | Δ = 0.03 | Δ = -0.21 | Δ = 0.10 | Δ = 0.24 | Δ = -0.25 |
| t = -0.65 | t = 0.81 | t = -8.25 | t = 1.39 | t = 3.61 | t = -4.37 | |
| p = 0.878 | p = 0.878 | p < 0.001* | p = 0.199 | p = 0.014* | p = 0.007* | |
| g = -0.19 | g = 0.23 | g = -2.38 | g = 0.40 | g = 1.04 | g = -1.26 | |
| Step | Δ = 0.05 | Δ = -0.19 | Δ = 0.14 | Δ = -0.35 | ||
| t = 1.74 | t = -9.32 | t = 3.71 | t = -8.23 | |||
| p = 0.349 | p < 0.001* | p = 0.014* | p < 0.001* | |||
| g = 0.50 | g = -2.69 | g = 1.07 | g = -2.38 | |||
| Dash | Δ = -0.24 | Δ = -0.49 | ||||
| t = -7.84 | t = -12.86 | |||||
| p < 0.001* | p < 0.001* | |||||
| g = -2.27 | g = -3.72 | |||||
Interaction plots for both dependent variables are shown in Figure 3.2, highlighting in particular the increase in peak vGRF for all movements when switching from a precision to a running landing style. Figure 3.2 also illustrates the kong vault as resulting in the greatest GRFs of any movement in either landing style, while the dash vault results in the least. The close clustering of the drop, step vault, and dash vault movements can also be seen in both vGRF and bGRF for the precision landing style.
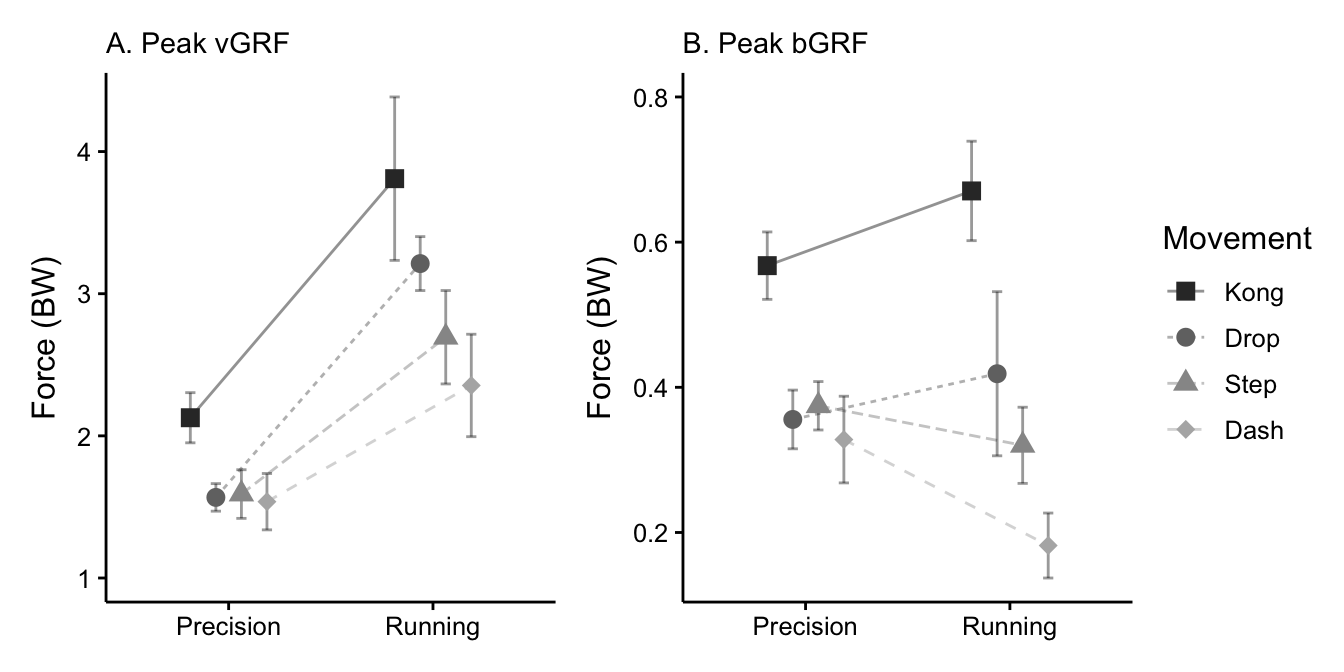
Figure 3.2: Interaction plots for peak vertical (A) and braking (B) ground reaction forces. Error bars depict 95% confidence intervals for means with a Cousineau-Morey adjustment for repeated-measures studies (O’Brien and Cousineau, 2014).
Means and standard deviations for all movement and landing style combinations are reported in full in Appendix A.