

(Tidy Tuesday is a project to supply weekly data sets for R users to practice their coding skills on. You can find full details here.)
This week’s Tidy Tuesday dataset “contains publicly available information about all astronauts who participated in space missions before 15 January 2020 collected from NASA, Roscosmos, and fun-made websites.”
Without a clear immediate question jumping out at me, I played around with the dataset a bunch to see what random variables I could make it spit out. I ended up with an average mission length for astronauts that flew more than one mission. Since I hadn’t really had a chance to play with creating a dumbbell plot before, I gave it a go.
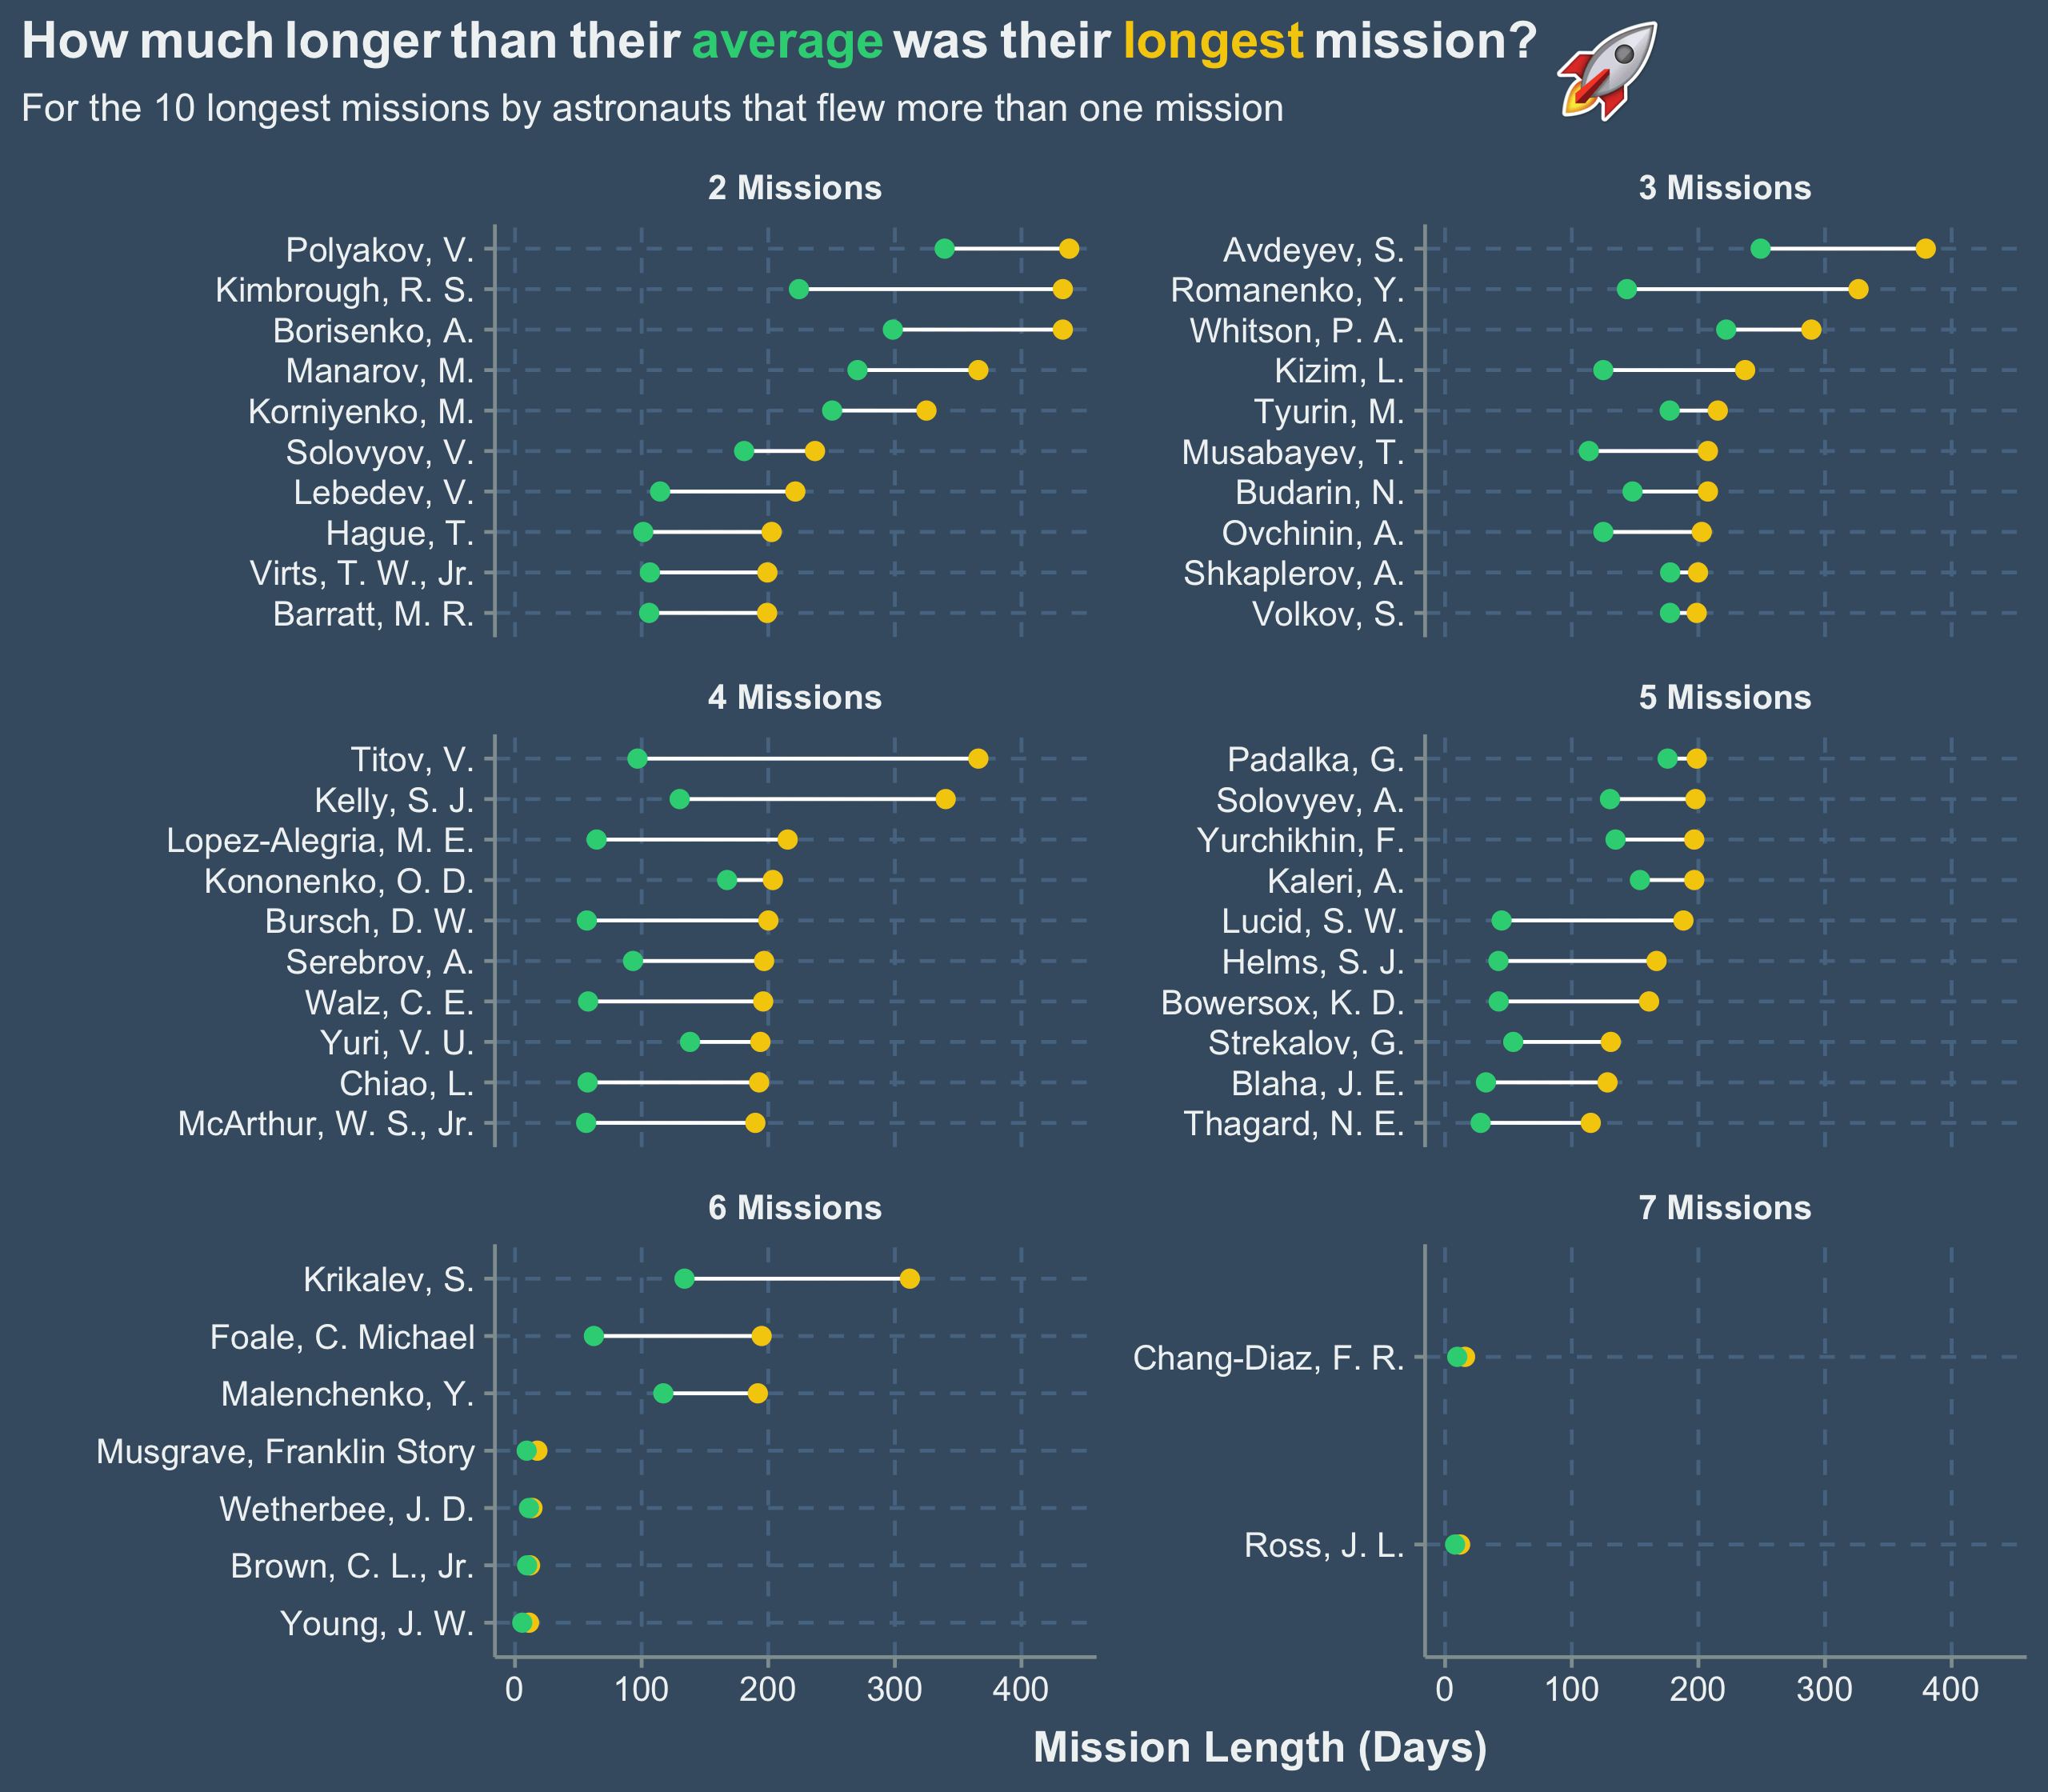
It came out quite nicely as a visual, but the thing I really love about this plot is how utterly useless this information really is. I mean, it answers the question, but so what? I can’t think of a situation where knowing this going to be particularly useful in solving a problem. Perfect!
I used reorder_within from tidytext to order the astronaut names by longest mission within each facet of mission number. It’s one of the most useful functions for plotting I know, kinda hidden away in a package that I never use anything else from. I did hit a small glitch where you need to also use reorder_within on xend in geom_segment for the lines of the dumbbells to line up properly. That took a minute to figure out.
Also a fun bit of use of ggtext to put colour into the plot title, as it was much easier than trying to figure out how to put in a legend for the dumbbell ends. And a shout out to Regex101 for helping me put together the str_replace_all to abbreviate all the astronaut names.
Code:
library(tidyverse)
library(tidytuesdayR)
library(here)
library(tidytext)
library(ggthemr)
library(cowplot)
library(ggtext)
library(glue)

ggthemr("flat dark", type = "outer")

data <- tt_load(2020, week=29)$astronauts

avgs <- data %>%
  group_by(name) %>%
  summarise(across(hours_mission, mean, .names = "mean_{col}"),
            longest_mission = round(max(hours_mission)/24, 2),
            no_mission = unique(total_number_of_missions),
            total_hrs = unique(total_hrs_sum)) %>%
  mutate(avg_days_per_mission = round(mean_hours_mission / 24, 2),
         total_days = round(total_hrs / 24, 2)) %>%
  arrange(desc(avg_days_per_mission)) %>%
  select(-mean_hours_mission, -total_hrs) %>%
  filter(no_mission > 1) %>%
  group_by(no_mission) %>%
  slice_max(longest_mission, n=10) %>%
  ungroup()

plot <- avgs %>%
  mutate(no_mission = glue::glue("{no_mission} Missions"),
         name = str_replace_all(name,
                                "(\\w+), (.)[a-zA-Z]+($|( .).($|(, Jr)))",
                                "\\1, \\2.\\3"),
         name = str_replace(name,
                            "Yuri Vladimirovich Usachyov",
                            "Yuri, V. U.")) %>%
  ggplot(aes(x = reorder_within(name,
                                longest_mission,
                                no_mission))) +
  geom_segment(aes(xend = reorder_within(name,
                                         longest_mission,
                                         no_mission),
                   y = avg_days_per_mission,
                   yend = longest_mission),
               color = "white") +
  geom_point(aes(y = longest_mission),
             color = swatch()[4],
             size = 2) +
  geom_point(aes(y = avg_days_per_mission),
             color = swatch()[3],
             size = 2) +
  scale_x_reordered() +
  coord_flip() +
  facet_wrap(vars(no_mission), ncol = 2, scales = "free_y") +
  labs(x = "",
       y = "Mission Length (Days)",
       title = glue("How much longer than <span style='color:{swatch()[3]};'>average</span> was their <span style='color:{swatch()[4]};'>longest</span> mission?"),
       subtitle = "For the 10 longest missions by astronauts that flew more than one mission") +
  theme(plot.title.position = "plot",
        plot.title = element_markdown(),
        strip.text = element_text(face = "bold"),
        axis.title.x = element_text(face = "bold"))

ggdraw(plot) +
  draw_image(here("astronauts", "rocket.png"),
             scale = 0.06, x = .25, y = .45)
